
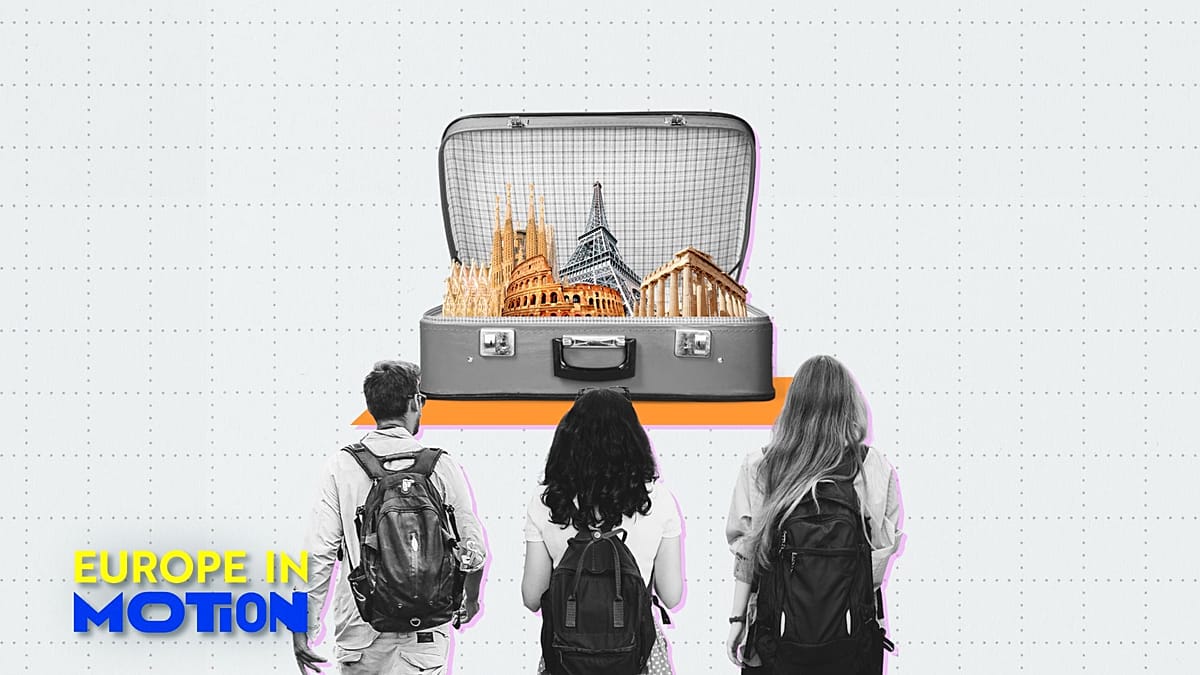
EU residents took almost a week’s holiday in other EU countries in 2024, with Greece and Romania recording the longest stays for visitors, according to the latest data from Eurostat.
Both countries averaged around 9 nights, above the EU average.
In contrast, Estonia and Belgium had the shortest tourist stays, at 3.1 and 3.6 nights respectively.
These differences in travel duration across the European Union are often related to transport accessibility and proximity to other countries.
For example, the price and distance to Greece, Spain, and Cyprus, as well as their popularity as holiday destinations, motivate tourists to stay longer.
On the other hand, Belgium is close to the Netherlands and France and is easily accessible, making a short visit of a few days more likely.
Visitors spend an average of 851 euros per trip, ranging from 344 euros in Slovakia to 1,476 euros in Cyprus.
Around one in four trips to the EU took place in August (12.8%) and July (11.7%).
What are the popular accommodation types for EU travelers?
More than two-thirds of your nights in the EU will be spent in rented tourist accommodation.
Hotels or similar accommodation topped the list at 39%, while 25% of all tourist overnight stays in the EU were spent in houses, villas or apartments, and only 7% in campgrounds.
Despite short-term rentals being one of the most popular options for EU tourists, the European Commission has promised that: upcoming bills About short-term rental agreements to address the housing crisis.
The EU has identified short-term rental platforms such as Airbnb, TripAdvisor and Expedia as a major cause of Europe’s affordable housing shortage, but has not said to what extent it intends to regulate them.
Local governments have more authority than the central government in this respect. some casesthey are already in action.
EU residents took 250 million tourist trips of at least one night to destinations in other EU countries in 2024.
Just under half (44%) of these trips used a car as the primary mode of transportation.
This was followed by airplanes at 41%, trains at 7%, and buses at 5%.